Investigating,the,Relevance,of,Arabic,Text,Classification,Datasets,Based,on,Supervised,Learning
来源:优秀文章 发布时间:2023-01-22 点击:
Ahmad Hussein Ababneh
Abstract—Training and testing different models in the field of text classification mainly depend on the pre-classified text document datasets.Recently, seven datasets have emerged for Arabic text classification, including Single-Label Arabic News Articles Dataset (SANAD), Khaleej, Arabiya, Akhbarona, KALIMAT, Waten2004, and Khaleej2004.This study investigates which of these datasets can provide significant training and fair evaluation for text classification(TC).In this investigation, well-known and accurate learning models are used, including naive Bayes (NB), random forest (RF), K-nearest neighbor (KNN), support vector machines (SVM), and logistic regression (LR) models.We present relevance and time measures of training the models with these datasets to enable Arabic language researchers to select the appropriate dataset to use based on a solid basis of comparison.The performances of the five learning models across the seven datasets are measured and compared with the performances of the same models trained on a well-known English language dataset.The analysis of the relevance and time scores shows that training the SVM model on Khaleej and Arabiya obtained the most significant results in the shortest amount of time,with the accuracy of 82%.
Text classification (TC) is defined as a text mining process that aims to specify the class or category of a given textual document.The output of such a process can be viewed as a set of classes; each of them contains a set of text documents that represents a specific topic or kind.Single-label TC provides a single label for each document, whereas multi-label TC may generate multiple labels for each document[1].
The massive amount of texts found on the web and the amount of texts that is being loaded every second necessitate a classification model that can classify each document into its appropriate category, facilitating tasks in other fields, such as natural language processing and information retrieval tasks[2].The importance of TC in other text mining fields has been deeply emphasized by Elnagaret al.[1],[3].
The training and evaluation of newly developed models in the field of TC mainly depend on the existence of a pre-classified dataset or corpus of text documents[4].A large number of datasets based on the English language have been evaluated for developing TC models using various statistical learning models.In [5]Zhanget al.listed these datasets with their respective statistics, including the number of text documents contained in training and testing sets, the number of classes, and accuracy obtained using several supervised and unsupervised learning models on these datasets.The construction of datasets for the TC research purpose for the Arabic language, which is at the core of this research, is still in its early stages.However,promising research in this field has recently emerged, creating new datasets, such as Single-Label Arabic News Articles Dataset (SANAD), NADiA, and KALIMAT.
In the field of TC, selecting appropriate datasets is typically a major challenge; thus, researchers should have clear understanding of the data on which a model will be trained and tested to obtain unbiased and significant results[5].It is critical to evaluate the existing datasets and assess whether these datasets were prepared according to a scientific approach.Well-prepared datasets imply consistent judgment across different TC models.
From our viewpoint, two important factors should be considered when assessing the effectiveness and usefulness of a dataset:
1) Experiments should be conducted on the dataset using successful machine learning (ML) models in the field of TC.In general, supervised TC models have achieved significant results and have been used in this field since 1968[6].Support vector machines (SVMs), logistic regression (LR),K-nearest neighbor (KNN), etc.have been used intensely in this field.A lot of studies, with various ML models, achieved consistent results[7]-[12].Thus, a new dataset, with its training and testing set, should produce comparable results if it is processed using such pre-trained ML models.
2) The dataset should be compared with the existing datasets.This comparison includes the application of uniform TC models with uniform implementation constraints.In addition, it includes standard accuracy measures that have been used to evaluate TC models, such as the precision, recall,f1-score, macro_avg,and weighted_avg.Furthermore, a heat map could be constructed for each run to provide a clear picture of the behavior of classifiers over each dataset.
In this paper, we focus on assessing the quality of Arabic language datasets that have been constructed for training and evaluating TC models developed especially for single-label Arabic TC.The Arabic language is imperative because it is used for more than 450 million people and the religious language for all Muslims worldwide[13].Furthermore, the Arabic language has unique features that make the text processing of the language such a challenging task.These features include 1) the inflectional and derivational nature of the language, 2) the lack of capitalization and short vowels, 3) the existence of different variations of the language in use—the modern, classical, and colloquial, and 4) the permission of the construction of a sentence with an implicit subject[14].
Several Arabic language datasets have been created for training the newly developed TC models.These datasets include SANAD, Khaleej, Arabiya, Akhbarona[15], KALIMAT, a multipurpose Arabic corpus[16],Waten2004[17], and Khaleej2004[17].There are other datasets, but these datasets do not contain a reasonable number of text documents.This study presents a comprehensive guide for researchers in the field of Arabic TC on the best and reliable datasets to use for model training and evaluation.This research aims to investigate existing Arabic datasets that can provide significant model training and fair evaluation of the models for TC.To achieve this aim, several classifiers have been developed and implemented.These classifiers are based on well-known and tested supervised TC methods.These classifiers are tested on the previously mentioned Arabic datasets.The analysis also includes a comparison with an English dataset that has been used in several research studies[18]-[22].
After introducing the main problem and explaining our aim in Introduction, the remaining sections of the paper are structured as follows.Section 2 describes the learning models used in our experiment.Section 3 illustrates a general framework and highlights steps performed before, during, and after training the models.Section 4 evaluates the models’ training relevance results and highlights the main findings.Finally, Section 5 draws the main conclusion.
Both the supervised and unsupervised ML approaches have been examined in the field of TC[6],[23],[24].The difference between supervised and unsupervised learning lies in labeled data.Supervised learning models use labeled data that represent the models’ knowledge repository, and then use this knowledge to make future predictions.Simply, we teach a model with a sufficient amount of data and then make the model for future predictions.For unsupervised learning models, data are unlabeled, and the models are not aware of any information about the classes or categories in the data; these models attempt to find meaningful patterns in the data[24].
In this paper, learning models in our experiments include a multinomial naive Bayes (NB) classifier, an SVM classifier, a random forest (RF) classifier, a KNN classifier, and an LR classifier.These classifiers adopted the supervised learning approach, and we have explained the reason for this choice in Introduction.The following subsections explain the five models.
2.1.NB Model
The NB classifier is one of the simplest classification learning models but has achieved reasonable accuracy[25],[26].Experiments have shown that it is comparable to advanced models, such as SVM models[7].Furthermore, it is considered an efficient learning method[27], and, as Jianget al.mentioned in [28], NB is among the top ten data mining algorithms due to its efficiency and simplicity.
NB is a family of models.They use the NB assumption, given pairs of datais a point in ad-dimensional real space,andyi∈Y, whereY={1,2,…,m} is a finite set of classifications.A probabilistic model or a joint distribution betweenxandycan be built under the following assumption:
Assume a family of distributionsPθforx(i)∈Rdandyi∈Y, such that

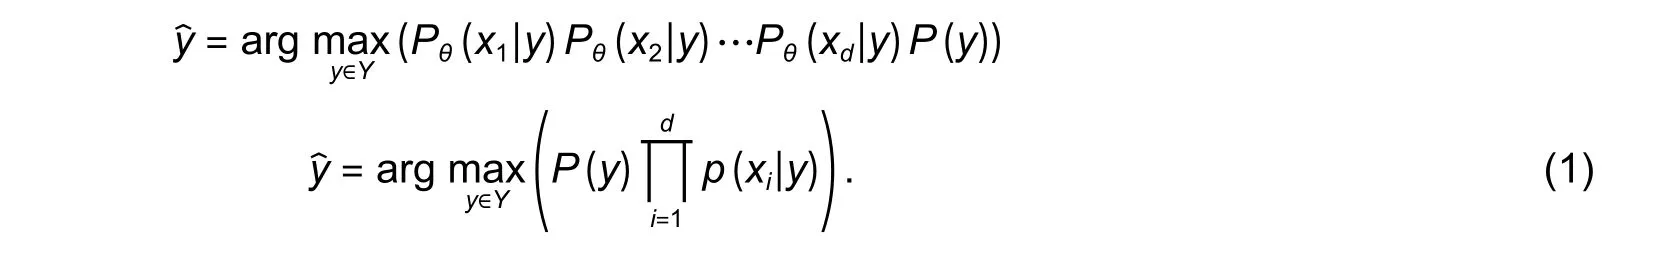
In TC,xandycan be expressed as documents and their classes or words.x-values represent features, and these features may be represented by numerical values, such as frequency.Regardless of the numerical representation of features, the fundamental assumption in NB is the conditional independence[27]:

If we have anotherx∈Rd, we need to predicty.We need to estimateθfromD(e.g., using the maximum likelihood); then, we could computeyfrom the equation:

From the NB rule:
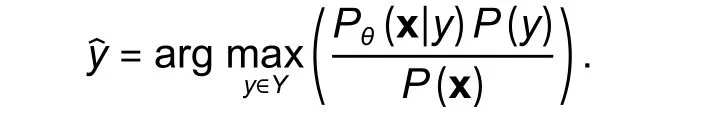
The denominator does not depend ony; we will omit it, and if we return to the conditional assumption, we can rewrite the previous equation as follows:
2.2.RF Model
RF is identified as one of the most popular and powerful ML algorithms that can perform both classification and regression tasks[29],[30].It is an ensemble ML approach, with a divide-and-conquer approach that combines multiple learning models to form one model to improve the performance[1].Thus, as the name suggests, the model creates several decision trees as a boost of a single tree in a cut model.The model builds up these multiple decision trees using an algorithm, such as the information gain or the Gini index approach[31].In general, the more trees in the forest, the more robust the classification, resulting in higher accuracy[32].
In RF, to classify a new object based on attributes or features, each tree provides its prediction, and the model chooses the classification that has the most votes (the majority voting) of the trees in the forest.These majority votes then help rectify the high variance which means that a model makes a poor prediction when the training dataset is changed and generally appears in a single decision tree model[31].Thus, RF has a low bias, because it is based on decision trees, and has low variance.It uses the bagging technique (the bagging technique is an ensemble ML approach), which combines multiple decision trees to form a single model.The low bias and variance reduce the overfitting problem, which happens when a trained model performs well with training data but provides inaccurate predictions with the testing data[33].
Complete mathematical analysis of RF can be found in [32].Assume the number of cases in a training set isN(or the number of items in the training data).Then, samples fromNcases will be taken at random but with replacement.If there areMinput variables or features, a numberm<Mis specified such that at each node,mvariables are selected at random out ofM.The best split ofmis used to split the tree node.The value ofmis kept constant, while the forest is grown.Each tree is grown to the largest extent possible, and there is no pruning.We can predict new data by aggregating the prediction ofktrees[30].
D={x1,x2,…,xn},xi∈Rdyi∈YY={1,2,…,m}
Given a training dataset and specified classes , where ,selectkrandom samples with replacement fromD, and build or fitkdecision trees, as follows:

Select random samples, with replacement, fromDandY; name them asDiYi.
FithionDiYi, wherehiis a decision tree learner that was constructed from theDirandom sample.
After training, classifying newx′into the appropriate class (or merely obtaining thevalue) can be made by taking the majority vote from all individual decision trees onx′:

Besides, the low bias and variance advantage of the RF classifier implies that the classifier takes less time for training and testing than other supervised learning models[30],[31].This is rational, because RF belongs to the low bias family, which reduces the number of assumptions made by RF to fit a model, and it needs a maximum of two tuning parameters[32].
2.3.KNN Model
KNN is a powerful classification model in the multidimensional classification space that provides competitive accuracy results[34]-[38].The estimation of the classification assumes that neighbors always share common features and, consequently, common classes.
KNN assumes that in thed-dimensional space, the closer the two objects, the more likely they belong to the same class.The closeness could be depicted as the distance between the objects or simply between points.The distance can be computed using the Euclidean, Hamming, Manhattan, or Minkowski methods.The closeness could also be seen as the similarity between the objects, and this similarity can be computed using one of the similarity computation methods, such as the cosine similarity[38].
KNN is a classical ML algorithm that has theoretical guarantees: Asnor the size of dataDbecomes huge,there is some theoretical guarantee about the performance of KNN[36].
Given a training datasetD={(x1,y1), (x2,y2),…,(xn,yn)},xi∈Rdand a finite set of classesyi∈Y,whereY={1, 2,…,m}, there is some distance metric, such as the Euclidean distance, which measures the distance between two points in thed-dimensional space such that

wherexi,xj∈Rd,xi=(xi1,xi2,…,xid), andxj=(xj1,xj2,…,xjd).In KNN, if we consider the distance between the newxcalledx′and its closest points (point) as the similarity measure, the class ofx′will be

If we consider the similarity betweenxiandxj, wherexiis a vector of features, such that=(xi1,xi2,…,xih)and=(xj1,xj2,…,xjl),xi,xj∈Rd, is[2]

we can generalize the similarity principle and reform (3) to be

KNN also has a probabilistic formulation[34]as follows.A random variabley:

whereP(y∣x,D) is the fraction of pointsxiinNk(x), andNk(x) is thek-nearest points toxi.
The predicted class ofx′is

2.4.SVM Model
SVM is a learning model that separates data into classes by creating balanced hyperplanes in a highdimensional space.The idea is to find hyperplanes that maximize the distances between the edges of the classes.SVM gradually seeks to find the maximum empty area between any pair of classes, which is represented as the margin that spans from the central line that separates two classes, to the boundaries of the classes[12].In a multi-classification model, SVM creates a set of hyperplanes and then chooses a subset of them that maximizes the separation margins[26].
SVM is considered a robust and accurate classification model.This judgment is based on a large number of research studies in different fields, which used SVM and achieved significant results[39]-[46].For the Arabic language, Qadiet al.[11]experimented with 10 supervised learning models, wherein using the SVM model was able to obtain the most significant performance result.A complete mathematical formulation of SVM can be found in [47], but a brief and summarized explanation is essential.
To illustrate the optimization behind the SVM model, we start from a simple linear model for the binary classification.Given thek-dimensional vectorsx(1),x(2), …,x(n), the training set, and input vectors=(x1,x2,…,xd), wheredis the number of features,xi∈Rd, andyis the classes’ labels,y∈YandY∈{1, -1}, the classification function is
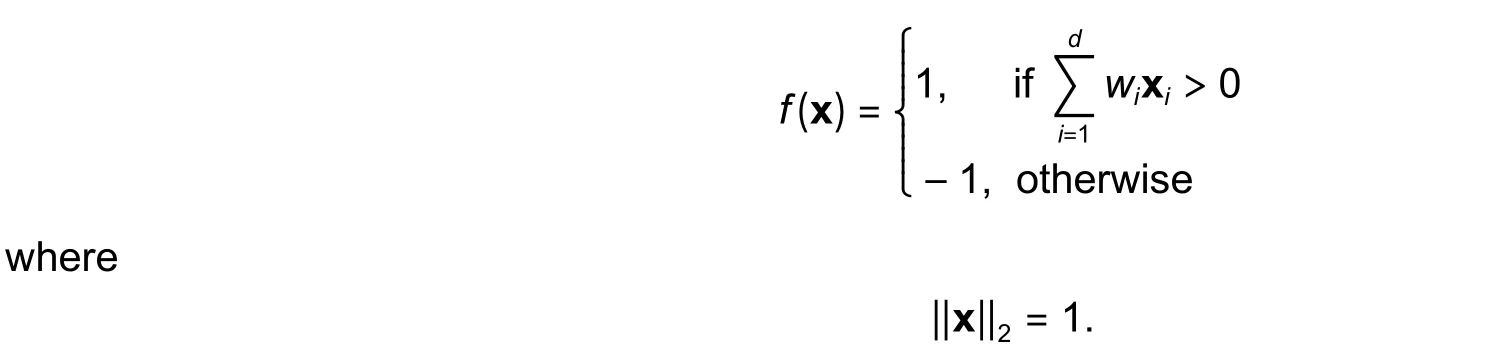
SVM depicts the data as instances that are embedded in ad-dimensional space and finds a weighted vector=(w1,w2,…,wd),wi∈Rd, such that the linew·x=θ, where operator “·” means the dot product,separates the boundary of two classes (as shown inFig.1).
Representing a text document in ad-dimensional space means that each distinct word (feature)establishes a dimension, and the document is a point in this space; the classification is performed by creating a separation line, such that all points that fall on one side of the line belong to class 1, while the points which fall on the second side belong to class 2, as shown inFig.2.
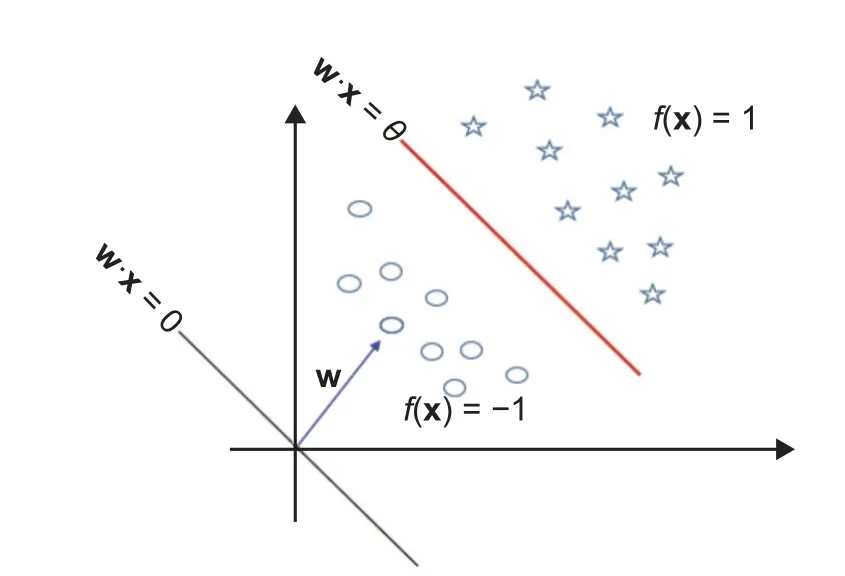
Fig.1.Binary linear classification.

Fig.2.Text documents on the feature space.
Now, to define the SVM classifier, we can update the idea of the linear classification.FromD,we have pre-labeled examples (training dataset),,y∈Y, andY∈{1,2,…,m}.Using the same technique in the linear classification, the dot product of the weighted vectorwand the vectorxis.
In linear classification, multiple lines can exist and separate their classes, but SVM seeks to find the best line that divides data points.To define the best line, SVM considers the distance from the separating line that tells us how confident a prediction is[48].Thus, SVM searches for the line that has the largest margins.
Define the margin 2γas the length of the empty area between the boundaries of the classes, and the best line is located at the middle of this area, as shown inFig.3.

Fig.3.Largest margins in SVM.

Then, the distance betweenAandLis
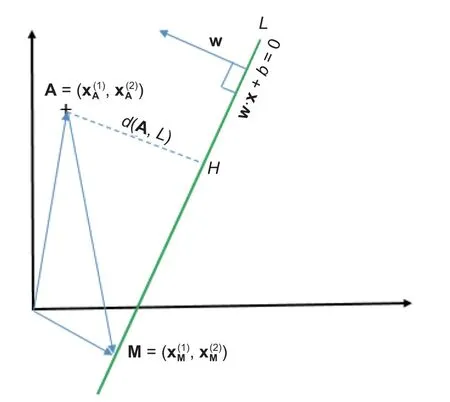
Fig.4.Computation of γ.

AndMis onL, so the=-b, then

This means that the distance or the margin betweenAandLis the vectorw, which is perpendicular to lineL, multiplying by the coordinates ofAplus the offsetb,γ=(w·A+b)y.So, we want to findwsuch that the smallest marginis as large as possible[47]:

and this leads to the initial optimization

such that

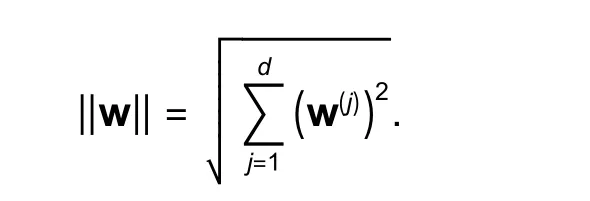
In the previous definition ofγ, the longer thew, the bigger the margin will be; thus, we need to normalizewby its length:

where
As shown inFig.5, lineLis defined by a few points that are located on the boundary (not by all points in the space).This means that we can ignore most of the points and focus on points that defined the line (these points are called the support vectors).Let us also require support vectorsxito be on the plane defined by

Fig.5.Relationship between γ and the support vectors.

To findγ, we need to find the relation between the support vectors: Assume thatx1is the support vector on one side of lineLandx2is the vector point on the other side ofL,

We can substitute the value of x1into the equationw·x1+b=1, and we obtain

Now, the equation w ·x2+b=-1, because it is on the other side ofL:

since

This implies that maximizingγcan be expressed as follows:

which is equivalent to

Therefore, (7) can be rewritten as

such that

So far, we implicitly assume that our data are linearly separable, and it is always possible to find the line that entirely separates the classes.However, most real datasets are noisy, which means that no such separable hyperplanes exist[49].Dealing with such data, where finding out a robust separator seems impossible and this almost happens in every dataset, implies to change our formulation and introduce the penalty parameter:

whereCis a control variable that can be set using cross-validation.
The previous equation means that the line should have a maximum margin and makes a small number of mistakes.However, the mistaken points do not have equal severity[49], and we can penalize them using the slack variableξ, as shown inFig.6.
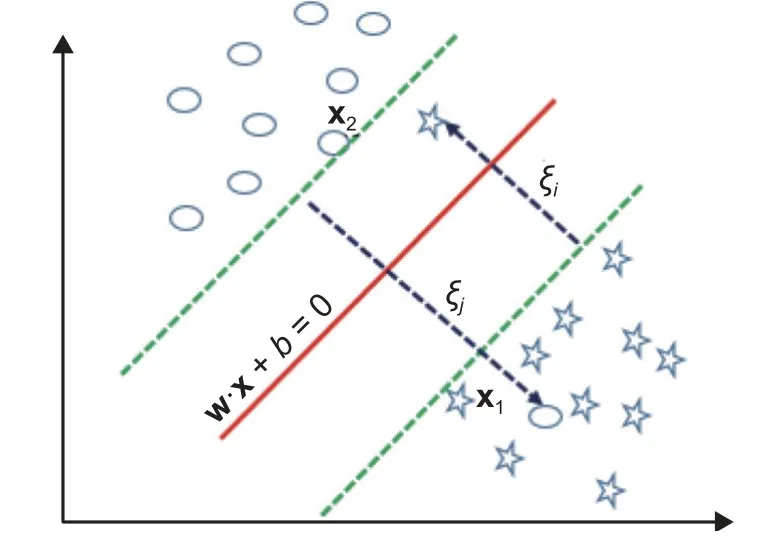
Fig.6.Separated line with slack variable ξ.

with the constraint

A new optimization problem appears in which our goal is to find the largest margin and the smallest sum of the penaltyξi:

2.5.LR Model
LR is one of the most widely used classification models[50],[51].Even the name contains the word“regression”, LR is mainly used for classification problems, because it predicts categorical values, not continuous ones.
In LR, we model our data with a linear functionf(w,b)=wx+b, wherewis the weight andbis the bias,and this produces continuous values.In LR, we seek to covert continuous values to the probability.LR models the probability using the sigmoid function[52]:

This prediction outputs a probability value between 0 and 1.
In the approximation functionhθ(x), we have to define thew(weight) andb(bias) using a specific cost function, such as the cross-entropy[52]:

LR optimizes the cost overwandbusing the gradient descent optimization strategy.It starts at some point and iteratively updates the parameters (wandb) through the calculation of the derivative and then follows the direction of the derivative until reaching the global minimum.In each iteration, the parameters are updated in small steps called the learning rateη.The gradient descent then updateswandbusing the following rules:

Furthermore, the derivatives can be performed using the following equations[51]:

This study’s goal is to measure the relevance of existing Arabic language datasets in the context of TC tasks using well-known and widely used supervised learning models.Therefore, we construct a complete experiment that includes the data collection of the existing datasets, text preprocessing, model implementation, and model performance and analysis.The framework established in this experiment is depicted in Fig.7.
3.1.Experiment Datasets
Fig.7shows all the steps performed during the implementation of this experiment.Note that the starting point is to collect datasets used and proposed in the field of TC for the Arabic language.As we stated in Introduction, the selection is based on the number of documents included in the datasets and on the number of classes into which the documents are classified.Therefore, many datasets have been excluded.Datasets selected in the experiment and their features are presented inTable 1.

Table 1: Features of the Arabic language TC datasets

Fig.7.Experiment framework.
InTable 1,seven datasets have been chosen and split into training and testing sets.These datasets have been recently proposed in TC as datasets for training and evaluating newly developed models for the Arabic language[3].Table 1shows that the number of documents in both training and testing sets in these datasets varies, ranging from 5690 documents in Khaleej2004 to 110900 in SANAD.
The SANAD dataset is the largest because it contains three merged datasets: Khaleej, Akhbarona, and Arabiya.Therefore, we process SANAD as one dataset, and as three datasets by splitting it into three parts.Table 1shows the connection between SANAD and the three datasets, and we refer to them as SANADKhaleej, SANAD-Akhbarona, and SANAD-Arabiya inTable 1, but throughout the paper, they will be referred to as Khaleej, Akhbarona, and Arabiya.We process SANAD in this way to determine whether we can use one of the three parts individually as training and testing sets, especially when they contain sufficient documents.These individual examinations of Khaleej, Akhbarona, and Arabiya have an efficiency effect, since there are significant differences in the size of SANAD as a whole and the sizes of its parts.
The other three datasets are KALIMAT, Waten2004, and Khaleej2004[15].These datasets are constructed in folders; each folder represents a class (culture, sport, religion, etc.).KALIMAT, Waten2004, and Khaleej2004 datasets are originally not split into training and testing sets, but for consistency with the SANAD’s datasets, we split them according to the splitting ratio used in SANAD.
For comparison, we use another dataset called “20_newsgroup dataset” that is built in English and has been used to the experiment with new classification models[18]-[22].Another reason that motivates us to use this dataset is the number of documents it contains (18846 documents), as it contains a moderate number of documents (most English language datasets have a huge number of documents, see [5]), it is comparable to the seven Arabic datasets shown inTable 1.
3.2.Dataset Preprocessing
The general preprocessing operations have been performed, which include the following:
1) Tokenization: This operation tokenizes a text and represents the text as a set of words or tokens.
2) Stopwords removal: This operation includes the removal of any kind of speech that is not a noun or verb.The list of distinct stopwords for the Arabic language contains more than 400 terms[13].
3) Stemming: The process of removing prefixes and suffixes of a token.The stemming operation is essential and has the positive efficiency and performance effect[14].
3.3.Learning Model Training
After preprocessing the text documents, the documents are then split into training and testing documents,as shown inTable 1andFig.7.Learning models are trained in the supervised learning context using the dataset to generate the required learning models.Five learning models are developed based on each training dataset.For example, the experiments developed five learning models for SANAD using five learning approaches described in Section 2.This allows us to measure the performance of each learning approach on each dataset and provides a way to measure how the learning approach suited each dataset.So, the total number of models that are learned from the eight datasets (including the English language one) is 40.
Python 3 is used to develop these models, and we use a machine with the 8-GB random access memory(RAM) and Intel(R) core™ i5-7200U CPU@2.50 GHz 2.71 GHz processor.This piece of information is important, so that readers can relate to the execution time analysis that appears in the evaluation section.
3.4.Outputs of Learning Models
The classification process is initiated using the 40 training models, and classification results are collected.Each document will automatically classified into a certain category based on the learning model.The outputs of the learning models are a set of categories.The grouped documents share certain criteria based on the learning method used to perform the classification process.Therefore, for the 8 datasets, we have 40 classification output sets (because each dataset was used to train 5 classification methods).The automatically generated output takes the following quadruple shape:

The quadruple (SVM, Arabiya, 103, Politics) means that the SVM model classifies document 103 in the Arabiya dataset into the Politics category.
This representation helps grasp the automatically generated category of the document using different learning models.For example, the same document (103 in Arabiya) has been classified by KNN into the Finance category, and this fact can be easily discovered by processing the quadruple (KNN, Arabiya, 103,Finance), which means that the KNN classifier classifies document 103 in the Arabiya dataset into the Finance category.Since document 103 talks about a loan from the International Monetary Fund to Egypt, the two classification results seem both reasonable.
The output sets of all experiments are large; they equal the number of documents in the testing sets multiplied by 5.However, the important thing is to measure the classification accuracy and relevancy of each learning method on each dataset.This means that the automatically generated classifications should match the classifications obtained using the testing sets in a significant ratio.The well-known accuracy and relevancy measures in the field of TC are described in the next subsection.
3.5.Accuracy and Relevance Measures
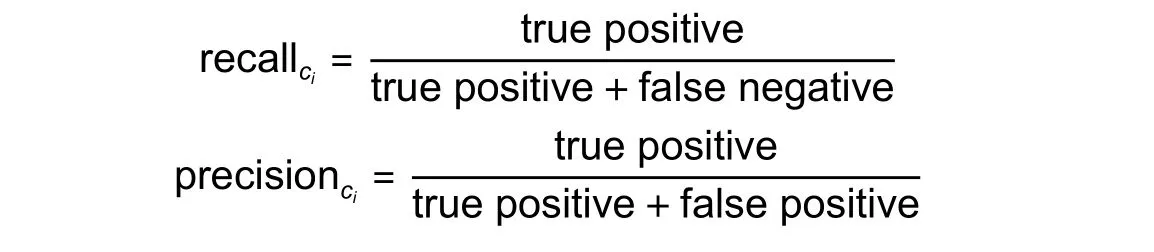
The testing phase is established using the testing set of each dataset.The testing set contains preclassified documents (actual classes), and then the learned model predicts a class for each document.Important relevance measures are used to measure the match performance between the pre-classified classes and predicted classes.The performance metrics used in this study include the precision, recall,f1-score, macro_avg, weighted_avg, accuracy, and confusion matrix.For clarity, we assume the following:
1) True positive: The number of documents that are classified into classciand should be inci.
2) False positive: The number of documents that are classified into classciand should not be inci.
3) True negative: The number of documents that are not classified into classciand should not be inci.
4) False negative: The number of documents that are not classified into classciand should be inci.
5) Support: The actual number of documents in each class (taken from the testing dataset).
The relevance measures include

The confusion matrix has also been used in the evaluation, which tells us if the classification model did right or wrong[38].The confusion matrix has been depicted in a heat map form to ensure clarity for readers.The confusion matrix takes the following form:

wherexdenotes the number of documents classified into Class 1 and predicted by the learning model as Class 1, whereasyrepresents the number of documents classified into Class 1 and predicted by the learning model as Class 2.Thus, the main diagonal represents the learning model’s correct classification (the actual and the predicated match).
The relevance measurement outcomes for each learning model on the eight datasets are collected for further analysis and discussion.The aim is not to choose a particular dataset or model; the aim is to show,using empirical experiments, the features of each model over the Arabic language datasets shown inTable 1.
4.1.Accuracy Measure
The final accuracy results are displayed in Fig.8.Note that the accuracy of the LR and SVM models is higher than that of the other models on all datasets, and it shows that all learning models, except the RF model, obtain the highest accuracy on the English language dataset.The accuracy of all models on the Khaleej and Arabiya datasets is convergent and is higher than the accuracy on the other Arabic language datasets.In this study, all learning models obtain the lowest accuracy on the Waten2004 dataset.
4.2.Execution Time
The accuracy of the five classifiers is supplemented with the time (in seconds) taken to train and develop each model.Table 2shows the time in seconds required to develop each model over the eight datasets.The horizontal view represents the time according to the datasets,whereas the vertical view represents the time according to the learning models.Table 2shows that both the LR and SVM models consume a considerable amount of time to be able to achieve the final accuracy, as shown inFig.8, whereas the KNN model consumes the lowest time.

Fig.8.Accuracy results of the five learning models over the eight datasets.
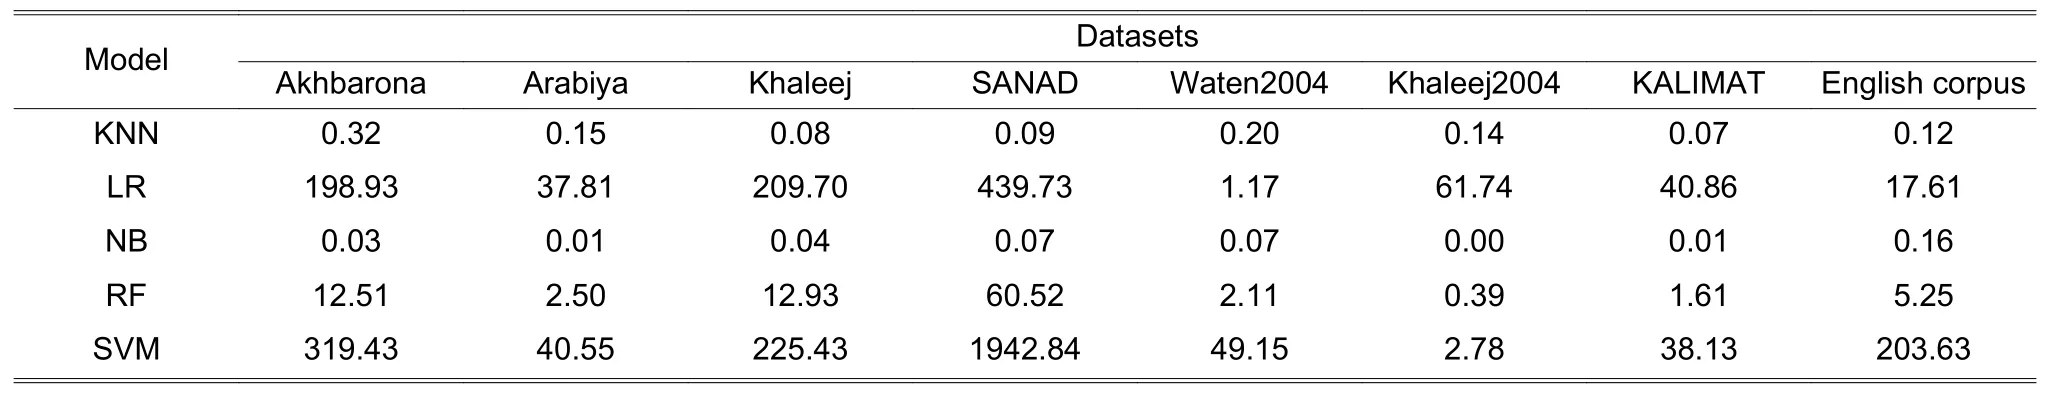
Table 2: Time in seconds required to build each model using the eight datasets
The vertical view of Khaleej and English corpus columns shows the convergence between the behavior of the five models on Khaleej and the English language corpus, respectively.And note that the time consumed by the LR and SVM models on the SANAD dataset is 439.73 s and 1942.84 s, respectively.When we compare this to the accuracy of these models over the SANAD dataset inFig.8, we see that the increase in the time penalty comes with no improvement in the accuracy level.
4.3.Relevance Measures
The time execution provides an idea of how long it takes to run each model over each dataset with the hardware specifications mentioned in subsection 3.3; it will not be a critical factor in the experiment, because the datasets have different sizes.Therefore, we explore the relevance measures, because they are important to determine which datasets contain sufficient semantic information that can yield a reasonable classification result.
4.3.1.Macro Average and Weighted Average
The accuracy curve inFig.8is supplemented byFigs.9to14, which also measure the relevance of each model over the eight datasets.InFigs.9to 14, the datasets are placed on thex-axis, while they-axis represents the relevance values (precision, recall, etc.).The presentation in this way allowed us to see the behavior of each model on the eight datasets separately as well as the behavior of the models in one picture.The salient points in these figures can be summarized as follows:
1) InFigs.9to14, two peaks appear; one at Arabiya, which spans to Khaleej, and one at the English language dataset.This note provides a positive indication about the possibility of using Khaleej and Arabiya as training datasets for TC tasks.For all learning models, these two datasets offer a productive environment that leads to significant relevant results.

Fig.9.The macro_avg of precision values of five learning models over eight datasets.

Fig.10.The macro_avg of the recall values of five learning models over eight datasets.

Fig.11.The macro_avg of the f1 score values of five learning models over eight datasets.
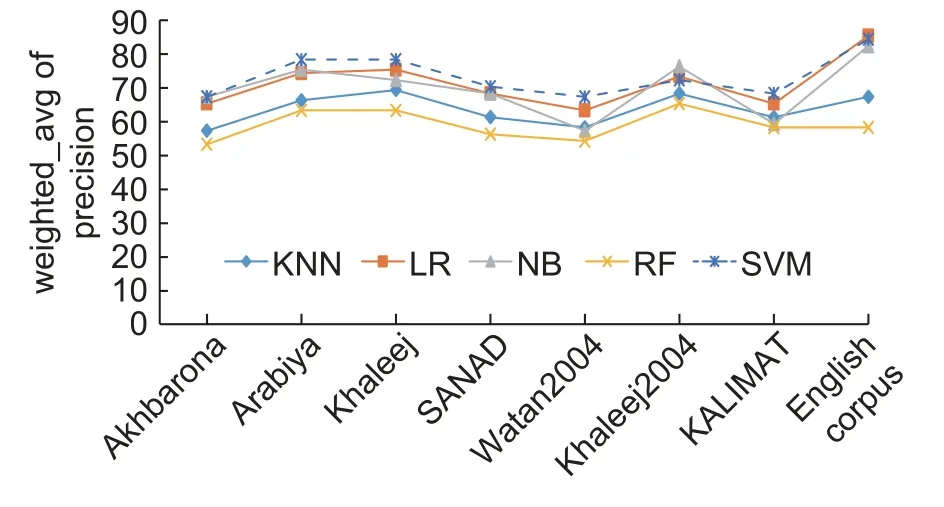
Fig.12.The weighted_avg of precision values of five learning models over eight datasets.

Fig.13.The weighted_avg of the recall values of five learning models over eight datasets.
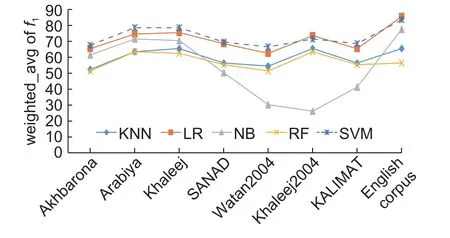
Fig.14.The weighted_avg of the f1 score values of five learning models over eight datasets.
2) InFigs.9to14, the curves are noted to decrease toward the SANAD dataset, which means that the learning models obtained smaller relevance values, except for the NB model, as shown inFig.9; however,the NB model shows unstable behaviors, as shown inFigs.9to14.This comment is valuable because it is mentioned before that SANAD is a collection of three datasets, that is, Arabiya, Khaleej, and Akhbarona, and when we process these three datasets separately using the learning models, we have obtained significant results.The question is why the fusion of these three datasets reduces relevance measures, which seems illogical because ML models should benefit from an increase in the dataset size.The answer to this question relies on the Arabic language.As we mentioned in Introduction, Arabic is a semantically rich language with a massive number of distinct terms.Although all Arab countries speak the same language, Arabic, each has its set of terms that are commonly used in its media.This variation in terms used from one country to the next impacts the statistics used by the learning model.
3) InFigs.9to14, the models show the lowest relevance on the Waten2004 and KALIMAT datasets except for the NB model; the reason for this comes from the categories chosen.Both of them contain International and Local categories, which contain International or Local news data.Both the Local and International categories contained documents that could be predicted or classified into another category.For example, if the document processed refers to an international sports event, there is a good chance that the learning model will classify this document into the Sports category rather than the International category.
4) According to relevance curves inFigs.9to14:
♦ The KNN and RF models show a similar trend, and their relevance scores are confined between 50%and 60%.
♦ The SVM and LR models show a convergent trend, and their relevance scores are confined between 70% and 85%.
♦ The SVM model obtains the most significant scores, which is consistent with the results shown inFig.8.
♦ The NB model shows significant results on Akhbarona, Arabiya, Khaleej, SANAD, and the English language corpus.
4.3.2.Confusion Matrix and Heat Map
The confusion matrix provides a clear picture of how the learning model predicted or classified the documents.Table 3represents the confusion matrix of the SVM model on Waten2004.The number of categories is six (Culture, Economy, International, Local, Religion, and Sports).The bold and underlined values are the numbers of documents that the SVM model classified correctly based on the actual classification.

Table 3: Confusion matrix of SVM on Waten2004 dataset
Confusion matrix interpretation is crucial because it provides information about the relationship between the categories.For example, 307 documents of 656 are classified into the Culture category, and they are preclassified in the testing set of Waten2004 in the Culture category, whereas 349 (33 + 30 + 80 + 133 + 73)documents that should be in the Culture category are incorrectly classified into other categories.Note that 133 of the documents that should be classified into the Culture category are classified into the Religion category, which means that the SVM model found relationships between the documents that belong to both categories.The confusion matrix can also reveal a problem in the classification process.The International category has 149 (33 + 27 + 37 + 21 + 31) misclassified documents, whereas the Local category has 296 (83+ 90 + 17 + 49 + 57) misclassified documents.We clarified the classification problem of International and Local categories when we analyzedFigs.9to 14, and the confusion matrix asserts our clarification.
As we find that the SVM model has obtained the most significant relevance results, we present the confusion matrices of the SVM model on the eight datasets.The confusion matrices are presented in the heat map form to facilitate the trace of the performance of the classification process, as shown inFigs.15to21.
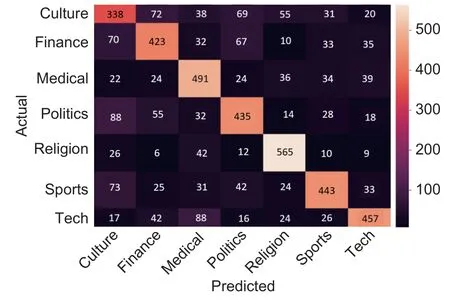
Fig.15.Confusion matrix of SVM experiment on Akhbarona dataset.

Fig.16.Confusion matrix of SVM experiment on Waten2004 dataset.
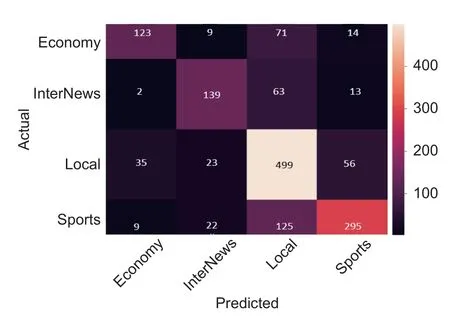
Fig.17.Confusion matrix of SVM experiment on Khaleej2004 dataset.

Fig.18.Confusion matrix of SVM experiment on Arabiya dataset.

Fig.19.Confusion matrix of SVM experiment on KALIMAT dataset.

Fig.20.Confusion matrix of SVM experiment on SANAD dataset.
InFigs.15to22, the color brightness of a cell represents the number of documents in that cell; the brighter the color, the larger the number of documents.The scale on the right of each figure shows where the color changes.Based on this fact, the classification using Arabiya (Fig.18) seems to be the most significant followed by SANAD (Fig.20) and Khaleej (Fig.21).In these three figures, the diagonal appears, which gives the positive indication of the classification quality.Moreover, the trend of the classification inFigs.18,20, and 21 is similar to the trend inFig.22, which represents the classification using the 20_newgroup dataset.Based on classifications represented inFigs.15to 17, and 19, we can see that brighten cells are not located on the diagonal parts of the maps, which could mean that the number of predicted documents that does not match the number of the actual classification is large.

Fig.21.Confusion matrix of SVM experiment on the Khaleej dataset.
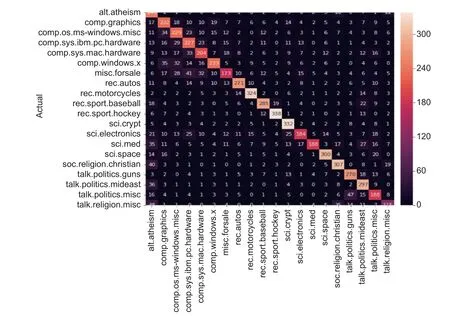
Fig.22.Confusion matrix of SVM experiment on the 20_newsgroup dataset.
4.4.Main Findings after Analysis
The relevance measures and time constraints should be used to determine which of the seven datasets should be used to train a classification model.In this paper, we aim to provide researchers with the required relevance measures upon which researchers can give their decision.Accordingly, we highlight the following findings from our experiment:
1) For the five learning models, the use of KALIMAT, Waten2004, and Khaleej2004 as training datasets has produced insignificant relevance results (e.g., for the SVM classifier, the accuracy rates using the datasets are 67%, 66%, and 70%, respectively (Fig.8)).Thus, there is no need to consider the time penalty.
2) The use of SANAD as a training dataset provides reasonable classification (Fig.20), but the time penalty is high (Table 2).The time required to train the SVM model with the SANAD dataset is ten times that required to train with the Khaleej dataset and 42 times that required to train with the Arabiya dataset.
3) The use of Arabiya and Khaleej, which are complete datasets that are fused to form SANAD, as training datasets for the five learning models, provides significant relevance results (Figs.8to14) with an acceptable time penalty (Table 2).The advantage of the Arabiya dataset is that it provides the most significant classification, and this is shown in the confusion matrix representation.However, the disadvantage is the fewer number of categories; Arabiya has only five categories (Fig.18).On the other hand, the Khaleej dataset has more categories, but the relevance score is the second-best (Fig.21).
4) The time required to process Akhbarona is less than that required to process SANAD (Table 2).Therefore, Akhbarona can be used instead of SANAD in training a learning model.
5) In the seven Arabic language datasets, the number of categories is small (Figs.15to21)—the maximum is seven categories.In contrast, the English dataset 20_newgroup contains 20 categories with 7 subcategories of the Computer category (Fig.22).The categories of the seven Arabic datasets are general and each can contain several subcategories.The detailed categories of the English dataset help in increasing the accuracy of the learning process.A future challenge is to create a dataset that contains a considerable number of categories and classify the documents into these categories in a consistent way that improves the learning strategy to develop a learning model with an accurate classification.
In the paper, we trained five well-known and widely used learning models using seven recently published Arabic language datasets for TC tasks.The SANAD, Khaleej, Arabiya, Akhbarona, KALIMAT, Waten2004,and Khaleej2004 datasets were studied.This study presented all relevance measures that are necessary for the researchers to decide which of these datasets provides the best training and testing environment for TC of the Arabic language text.The selected learning models included the well-known and accurate learning models that have demonstrated their competence in TC.
The decision of which dataset(s) to use as training and testing sets is based on the behaviors of these datasets during the training and evaluation of the learning models.The behavior was then measured through standard relevance and time measures obtained on 40 different learning experiments.After analyzing all experiments, we have found that the Arabiya and Khaleej datasets provided significant training, and this was reflected in their relevance measures, which reached 82%.Furthermore, we found that the learning time of the models on Arabiya and Khaleej was deemed reasonable.The SANAD and Akhbarona datasets showed a convergent relevance trend, with relevance scores ranging from 56% to 68%.However, the execution time to train the models using the SANAD dataset was insignificant.KALIMAT, Waten2004, and Khaleej2004 showed a moderate performance for both relevance and training time.
One shortcoming was observed in this study: The number of categories in the seven datasets is small compared with that in the existing English language dataset.The maximum number of categories in the Arabic datasets is seven, and all categories depict general topics that could be subdivided into subcategories.
Disclosures
The authors declare no conflicts of interest.
推荐访问:Arabic TEXT Investigating