Coseismic,surface,rupture,characteristics,and,earthquake,damage,analysis,of,the,eastern,end,of,the,2021,MS,7.4,Madoi,(Qinghai),earthquake
来源:优秀文章 发布时间:2023-02-08 点击:
Yno Zhng ,Yueren Xu,* ,Wenqio Li ,Runcho Liu ,Ruoyu Mu ,Jiyi Li ,D Zhng,Hofeng Li,Qinjin Tin
a Key Laboratory of Earthquake Prediction,Institute of Earthquake Forecasting,China Earthquake Administration,Beijing,100036,China
b Key Laboratory of Continental Collision and Plateau Uplift,Institute of Tibetan Plateau Research,Chinese Academy of Sciences,Beijing,100101,China
Keywords:2021-5-22 Madoi MS 7.4 earthquake Coseismic surface rupture Kunlunshankou-Jiangcuo fault Bayan Har Block Tibetan Plateau
ABSTRACT At 02:04 on May 22,2021,an MS 7.4 earthquake occurred in Madoi County in Qinghai Province,China.This earthquake is the largest seismic event in China since the 2008 MS 8.0 Wenchuan earthquake.Thus,it is critical to investigate surface deformation and damage in time to accurately understand the seismogenic structure of the Madoi earthquake and the seismogenic capacity of the blocks in this region.This study focuses on the Xuema Village,located at the eastern end of the coseismic surface ruptures produced by the event,and assesses the deformation and seismic damage in this area based on field surveys,UAV photogrammetry,and ground penetrating radar (GPR).The results indicate that the rupture scale is substantially smaller at the eastern end of the rupture zone compared to other segments.En echelon type shear tensile fractures are concentrated in a width range of 50–100 m,and the width of single fractures ranges from 20 to 30 cm.In contrast,the degree of seismic damage significantly increases at this site.All of the brick and timber houses are damaged or collapsed,while the steel frame structures and the color steel houses are slightly damaged.More than 80%of the bridge decks on the Changma River Bridge collapse,similar to the terraces along the Youerqu and Changma Rivers and the cut slopes of Provincial Highway S205.We infer that the seismogenic fault of the Madoi earthquake exerts a tail effect in this segment.The tension zone has led to a reduction at the eastern end of the rupture zone,causing shaking damage.Local topography and buildings without earthquake-resistant construction along the strike of the rupture zone have undergone different levels of seismic damage.
According to the China Earthquake Networks Center,an MS7.4 earthquake occurred at 02:04 on May 22,2021,in Madoi County,Guoluo Tibetan Autonomous Prefecture,Qinghai Province,China.The earthquake possesses a focal depth of 17 km and the epicenter is located at 34.59°N,98.34°E (Fig.1).Thousands of aftershocks have occurred within the two weeks following the mainshock,forming an~160 km aftershock belt.This earthquake marks the largest MS7.0+earthquake in Chinese mainland since the 2017 Jiuzhaigou MS7.0 earthquake.
The Bayan Har Block (BHB) is located in the middle–eastern part of the Qinghai-Tibet Plateau trends nearly E–W.The BHB is bounded by the Eastern Kunlun Fault (EKF) along its northern boundary,by the Ganzi-Yushu-Xianshuihe Fault Zone along its southern boundary,and by the Longmengshan and Minshan fault zones along its eastern boundary(Xiong et al.,2010;Ma et al.,2017).Since the 21stcentury,a number of strong earthquakes have occurred along the boundaries of the BHB,including the 2001 MS8.1 Kunlun Mountain Pass earthquake,the 2008 MS8.0 Wenchuan earthquake,the 2011 MS7.1 Yushu earthquake,the 2013 MS7.0 Lushan earthquake,and the 2017 MS7.1 Jiuzhaigou earthquake(Xu et al.,2006).Unlike the seismogenic structures of these previous strong earthquakes,the 2021 Madoi earthquake is determined to be generated by the NW-trending Kunlunshankou-Jiangcuo Fault(KLSK-JCF) (Jiang Cuo Section) within the BHB (Li et al.,2021a,b;Pan et al.,2021;Yin et al.,2021;Yuan et al.,2022).
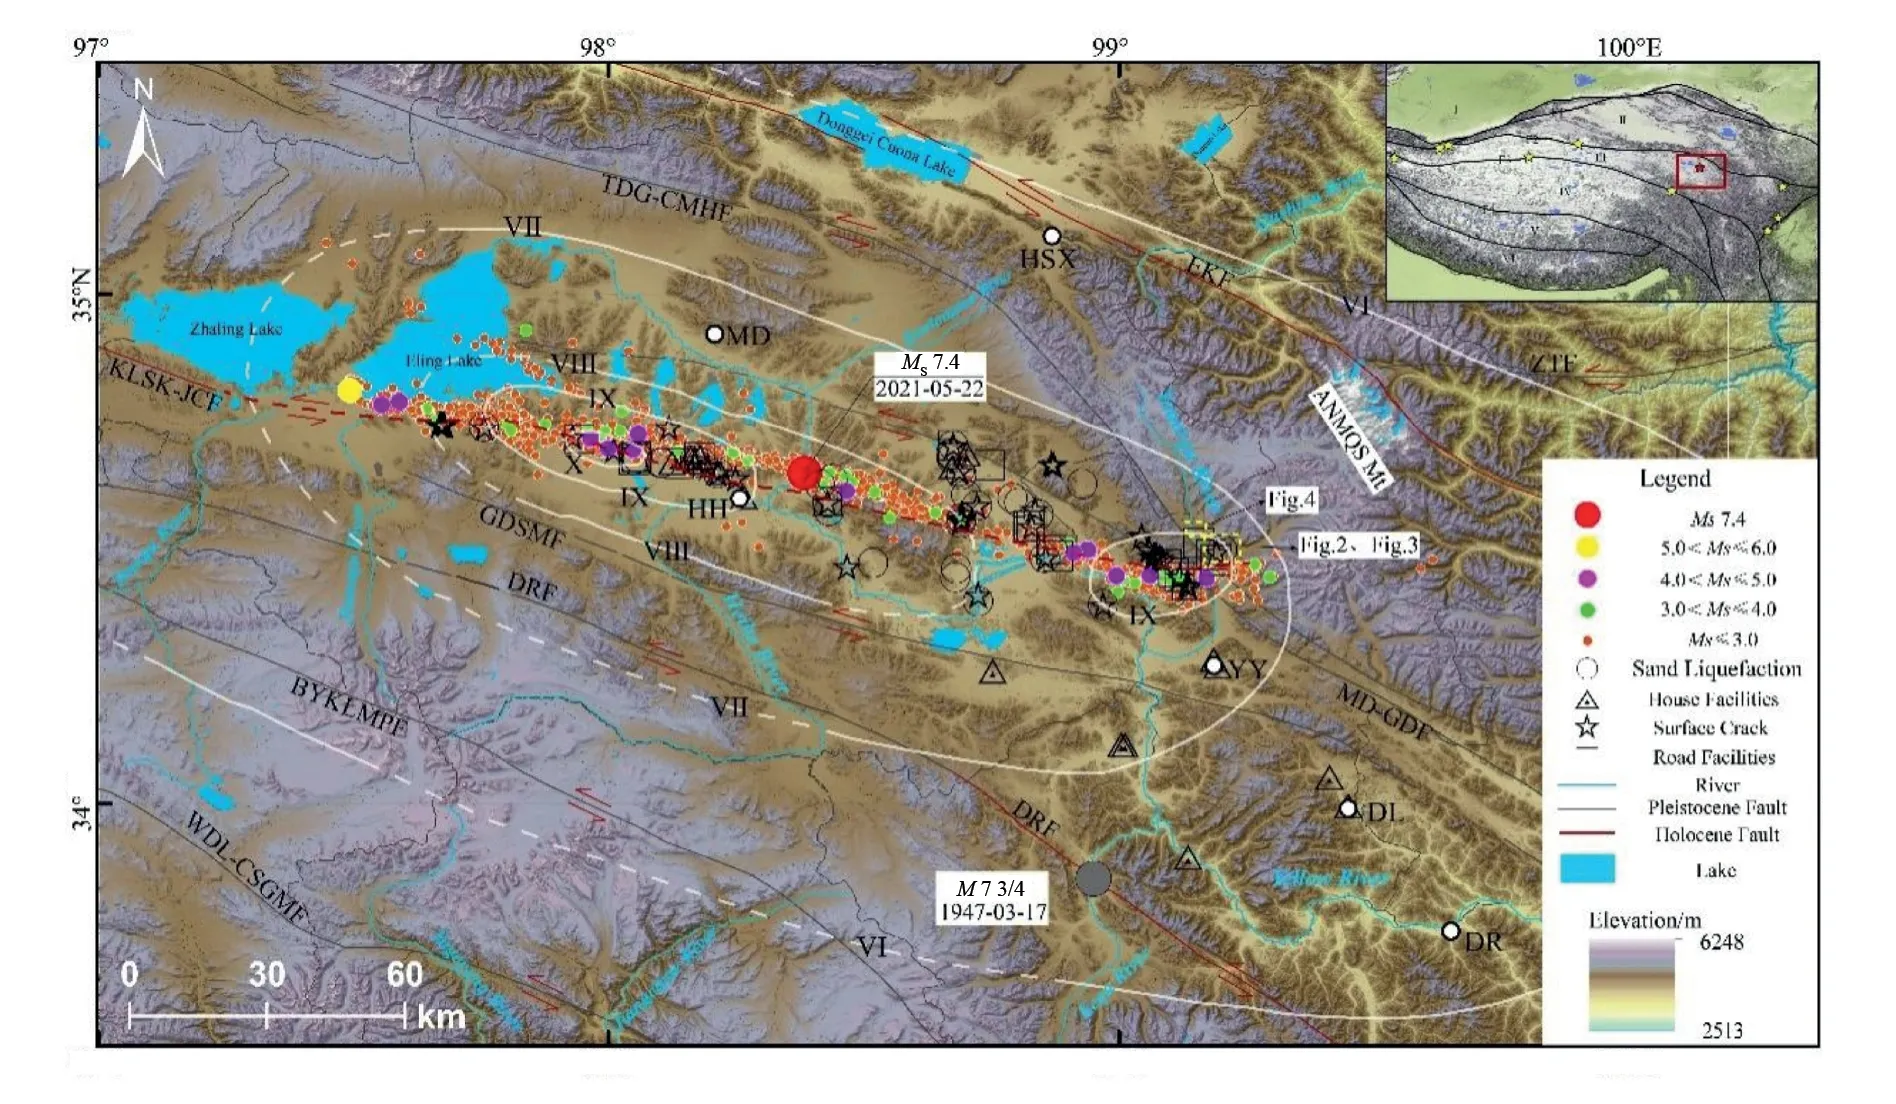
Fig.1.Geological map showing active faults in the Bayan Har Block.The location of the Madoi earthquake and its aftershocks are shown,as well as the locations of regional faults (Deng et al.,2003).The field survey locations are also exhibited.White dashed solid lines indicate earthquake intensities (iso-intensity lines from the Ministry of Emergency Management of the People"s Republic of China).The red dashed line indicates the eastward extension of the Kunlunshankou-Jiangcuo Fault(the seismogenic fault) (Li et al.,2021a,b;Yuan et al.,2022).The yellow dashed box indicates the study area.EKF:Eastern Kunlun Fault;TDG-CMHF:Tibet Dagou-Changmahe Fault;ZTF:Zhong Tie Fault;MD-GDF:Madoi-Gande Fault;KLSK-JCF:Kunlunshankou-Jiangcuo Fault;GDSMF:Gande Southern Margin Fault;DRF:Dari Fault;BYKLMPF:Bayan Har Main Peak Fault;WDL-CSGMF:Wudaoliang-Changsha Gongma Fault.
Immediately after the earthquake,we participate in an earthquake emergency survey organized by the China Earthquake Administration.During the field survey,we observe a large number of ground fissures,sand liquefaction,landslides,slope collapses,and house damage along the aftershock zone.The total length of this zone exceeds 100 km.Furthermore,the epicenter intensity is determined to be Ⅹ(Fig.1).It is worth noting that the overall trend of the aftershock zone is northwest to west;however,at the eastern terminus of the fault,the aftershock zone trends nearly E–W.The houses in Xuema Village(XMV)are completely destroyed.A 1.5 km surface crack is observed not far to the north.Attributed to sand liquefaction,the Changma River Bridge to the south is destroyed and cannot be used anymore.The results of the field survey indicate that this area has experienced an abnormally high earthquake intensity (Fig.1).Thus,we select XMV as the study area to analyze the surface rupture characteristics and related damage level.The results can be used to comprehensively analyze large seismic events in Qinghai-Tibetan Plateau.
The Qinghai-Tibetan Plateau consists of multiple sub-level blocks and the BHB is a the most representative block on the Qinghai-Tibetan Plateau that has undergone lateral compression since Cenozoic and is surrounded by several large faults.This region has produced some of the most intense earthquakes in China(Tapponnier et al.,1982;Deng et al.,2002;Zhang et al.,2003,2004;Xu and Stamps,2016).The BHB is divided into a series of sub-blocks based on the active faults within the block.
Due to the lack of historical seismic data records,the implementation of seismic and geological surveys in the Qinghai-Tibetan Plateau area is challenging.Therefore,the seismic structures of the KLSK-JCF,the Madoi-Gande Fault to the north,and the Dari Fault to the south are not well understood at present(Xiong et al.,2010;Liang et al.,2014,2020;Zhan et al.,2021).The Madoi-Gande Fault is a Holocene left-lateral strike-slip fault within the BHB,and has a total length of~650 km with obvious linear characteristics and a series of linearly distributed valleys.The fault strikes E–W to the west of Madoi and gradually diverts to NW at the northern margin of the Madoi Basin near Sichuan Province.(Xiong et al.,2010).The Dari Fault is also a late-Pleistocene left-lateral strike-slip fault within the BHB,along which an M 7¾ earthquake occurred in 1947.The seismic surface rupture of this earthquake is~70 km in length and the coseismic left-lateral dislocation is 2–4 m.The seismic manifestations of the Dari Fault include pressure ridges,seismic bulges and pits,turf tear zones,and linear fractured bedrock outcrops(Liang et al.,2014).
The data used in this study include the UAV survey data and ground penetrating radar (GPR) data.The UAV survey data are collected using the DJI Phantom4Pro platform.A high-resolution digital remote sensing device is used as the airborne sensor to collect raw visible light data and point cloud data,which are processed using the Agisoft PhotoScan Professional software package to obtain digital orthophoto map (DOM)(Fig.2)and digital elevation map(DEM)(Fig.3).GPR data are collected using a CUI MALA (Sweden) system equipped with RTA 50 MHz and RTA100 MHz super ground coupling antennas.Groundvision and Reflexw radar data processing are employed to perform bad track elimination,zero-point corrections,terrain corrections,filtering,deconvolution,offset,acquisition and other processes to obtain the final radar profile used for interpretation(Li,2012;Liu et al.,2004;Ralf et al.,2004;Yuan et al.,2022).

Fig.2.Composite Unmanned Aerial Vehicle (UAV) image of Xuema Village (XMV) showing the coseismic surface rupture.The white dashed circle indicates the location of XMV.Red short solid line segments are the interpretation of the surface rupture.The region enclosed by the purple dashed line is the seismic gravity ground fissure.The part of the yellow dotted line enclosed by the square is the sliding compression ground crack.The region enclosed by the blue dashed line is the road crack.
The UAV photogrammetry system used in this study is a low-altitude photography system with GPS navigation,remote control and monitoring,and automatic attitude and speed measurements.It also has the advantages of high flexibility,low influencing degree of various factors,strong pertinence,and highly accurate data acquisition(Peng et al.,2017;Zhang et al.,2020).The RTA super-coupling antenna used by GPR is convenient and effective for field surveys.The transmitting and receiving circuits are placed in a metal box.The antenna equipped with the latest technology is deployed for flexibility;thus,it can be used as a rope for detection.This ensures sufficient coupling with rugged and uneven surfaces without restrictions.The GPR system can be operated by a single person.Its detection depth is greater than that of conventional unshielded antennas with the same frequency,which guarantees the detection depth and improves the data resolution.When an earthquake occurs,due to the rapid mobilization of personnel and uncertain geological conditions in the field,both UAV and GPR surveys are applicable.
The research methods used in this study include field surveys,data acquisition,historical documentation,and laboratory analyses.When the Madoi earthquake occurred,emergency response researchers arrived in the site on May 23,2021.They first investigated the earthquake damage and then conducted a series of emergency investigations,suggesting that the characteristics of the eastern and western ends of the rupture zone are substantially different.A small area with an abnormal IX-level intensity is identified at the eastern end of the rupture zone,in which all brick and wood structure houses in XMV collapsed.The response team conducted another field survey in July 2021 to collect GPR data.Comparing the rupture characteristics at both ends of the rupture zone and interpreting the anomaly near XMV in the eastern section is critical for interpreting the Madoi earthquake and the characteristics of the eastern rupture zone.These processes are also important to understand the entire BHB and its interior.
4.1.Earthquake surface effect
After the field surveys,the rupture length of the MS7.4 Madoi earthquake is determined to be~160 km,which is consistent with the aftershock distribution (Li et al.,2021a,b;Xu et al.,2022;Yuan et al.,2022).The strike changes from NW to nearly E–W at the eastern end of the rupture zone.At eastern end of the rupture zone in XMV (in the anomalous Ⅸintensity degree area) (Fig.1),the surface effect is relatively remarkable and is mainly manifested as en echelon surface ruptures,sandblasting,compression ridges,slope collapses,damaged roads,house collapses,etc.XMV is located on the T2 terrace at the confluence of the Youerqu and Changma Rivers,21–25 m above the river.On the western side,the Youerqu River flows in the NW–SE direction.In the east,the Changma River flows in the NE–SW direction and merges with the Youerqu River(Figs.2 and 3).
4.1.1.Coseismic surface rupture
The coseismic surface ruptures extend from the right bank of the Youerqu River in the west (no surface cracks were observed on the western side of the extension,Fig.5a),traverse the river channel (the central river beach including tension cracks),and reach the T1 and T2 terraces on the left bank of the Youerqu River (Fig.5).The en echelon surface ruptures are located~100 m north of XMV,with a total length of~1.5 km.The ruptures extend to the right bank of the Changma River,producing a 40 cm wide crack on Provincial Highway S205.

Fig.3.UAV digital elevation map (DEM) of XMV.Red short solid line segments in the figure are the interpretation of the surface rupture,the yellow region is the extent of the T1 terrace of the Youerqu River,and the green region is the extent of the T2 terrace of the Youerqu River.Terrace profiles are shown in the upper left and lower right corners and correspond to the topographic profiles along lines P–P′ and F–F′,respectively.
The ground ruptures observed in XMV are mainly tension fissures and extruded ridges(Fig.6a and 6c),indicating that the faults are primarily dominated by horizontal motions,although no obvious horizontal dislocations have been observed.Hailong et al.(2021) measure a 1.1 m coseismic displacement on the left bank of the Youerqu River.As shown in Fig.6a,the straight cracks cut neatly through the upper turf and the lower soil layers.The depth of the turf is more than 1 m,and the turf is damaged unevenly at the crack boundary due to the end effect.As shown in Fig.6c,the irregularly extended tearing cracks has torn the turf downward,lifting some part of the turf.On the western side of Provincial Highway S205 near XMV,we observe a compressional rupture that intersects the main rupture zone at a high angle and forms a pressure ridge,similar to a thrust fault structure(Fig.2).As shown in Fig.6b,the surface on the side close to the Youerqu River is not affected.In contrast,the slope near Provincial Highway S205 is uplifted by~50 cm gradually.This type of uncoordinated surface effect may form under the action of ground motion and topographical deformation induced by the sliding front edge of the upper soil layer that is bounded by the freeze-thaw boundary (Fig.3).When an earthquake occurs,the temperature of the earthquake zone remains below freezing and the surface soil layer remains frozen.Therefore,straight and similar “knife-cut"-shaped surface cracks form in the frozen soil.In this scenario,the gravity collapse cracks on both banks of the Youerqu River and the right bank of the Changma River are also produced.Due to the fact that the earthquake occurs in the source area of the Yellow River,the water system is relatively developed,marshlands and river beaches cover a large area,and the local groundwater level is high.The freeze-thaw effect is inevitable in high-altitude areas,and surface ruptures are affected by the pre-existing topography,climate,and regional geological conditions,resulting in local amplification or attenuation of this effect.
4.1.2.Slope collapse-sand liquefaction
A 100 m long slope on the Changma River T2 terrace on the southern side of the XMV collapses (Fig.7b).Under the action of strong ground motion,the loose sand layer in the lower part of the slope slips,resulting in the collapse of the soil layer on the upper part of the slope.Although the amount of collapsed soil is not considerable,the slope collapse(without human interference)in a flat location such as a plateau indicates that the earthquake intensity in this area is strong.In addition,a large slope collapse area is observed along the Provincial Highway S205,located 2.5 km NW of XMV.It is nearly parallel to the highway and spreads continuously for several hundred meters(Fig.4).Several parallel arc-shaped extensional cracks are also observed at the rear edge of the collapse,extending across the highway to the left bank of the Youerqu River.Similar collapses are found on the riverbank (Fig.4).Soil blocks and turf collapses are clearly visible on the slope (Fig.7d).
Sand liquefaction points are seen on the left bank of the Youerqu River (Fig.7c).Only a few sand liquefaction points were observed,and the amount of sandblasting is large.The groundwater level in this area is high,ans thus saturation can be reached under the action of ground motion.The water-bearing sand layer is liquefied and ejected onto the ground surface along fissures or other weak points,including mouse or rabbit burrows.
4.1.3.Houses and road damage
Two days after the earthquake,a field survey was conducted in XMV to investigate the damage level.The UAV surveys of the XMV area suggest that all brick and wood structures in the village have collapsed,except for the lighter colored steel houses and steel-framed structures(Fig.8).The houses in XMV are mainly made by brick–soil and brick–lime materials which are poor in earthquake resistance.During the earthquake,the walls of the brick–soil houses have collapsed with falling upper roofs,causing serious damage(Fig.9a).The brick–lime houses are less damaged but cannot be used anymore.Part of the walls collapse over the foundation,while the foundation is only slightly displaced or remains undamaged.Cracks are observed on the walls,but the roof has not collapsed.The beams are dislocated and the roof tiles are scattered(Fig.9b–d).According to the information provided by eyewitnesses,when the mainshock occurred in the early morning of May 22,2021,a house collapsed and two people were buried by the rubble.Fortunately,two others escaped with the assistance of villagers,even though they are slightly injured on their arms.

Fig.4.UAV orthophoto at a distance of 2.5 km NW of XMV.Red solid line segments are interpreted as ground vibration gravity and highway cracks.Under the influence of the pre-existing topography,the ground cracks are affected by earthquake vibrations and gravity,and are arranged in an arc shape.The specific location is shown in Fig.1.

Fig.5.UAV photos of the surface rupture and extension on both sides of the Youerqu River.The red solid line delineates the surface rupture trace.

Fig.6.Field observation photos showing ground fissures.(a)Tension cracks on the ENE-trending surface rupture zone,(b)NW-trending sliding compression cracks.(c) Compression ridge on the ENE-trending surface rupture zone.
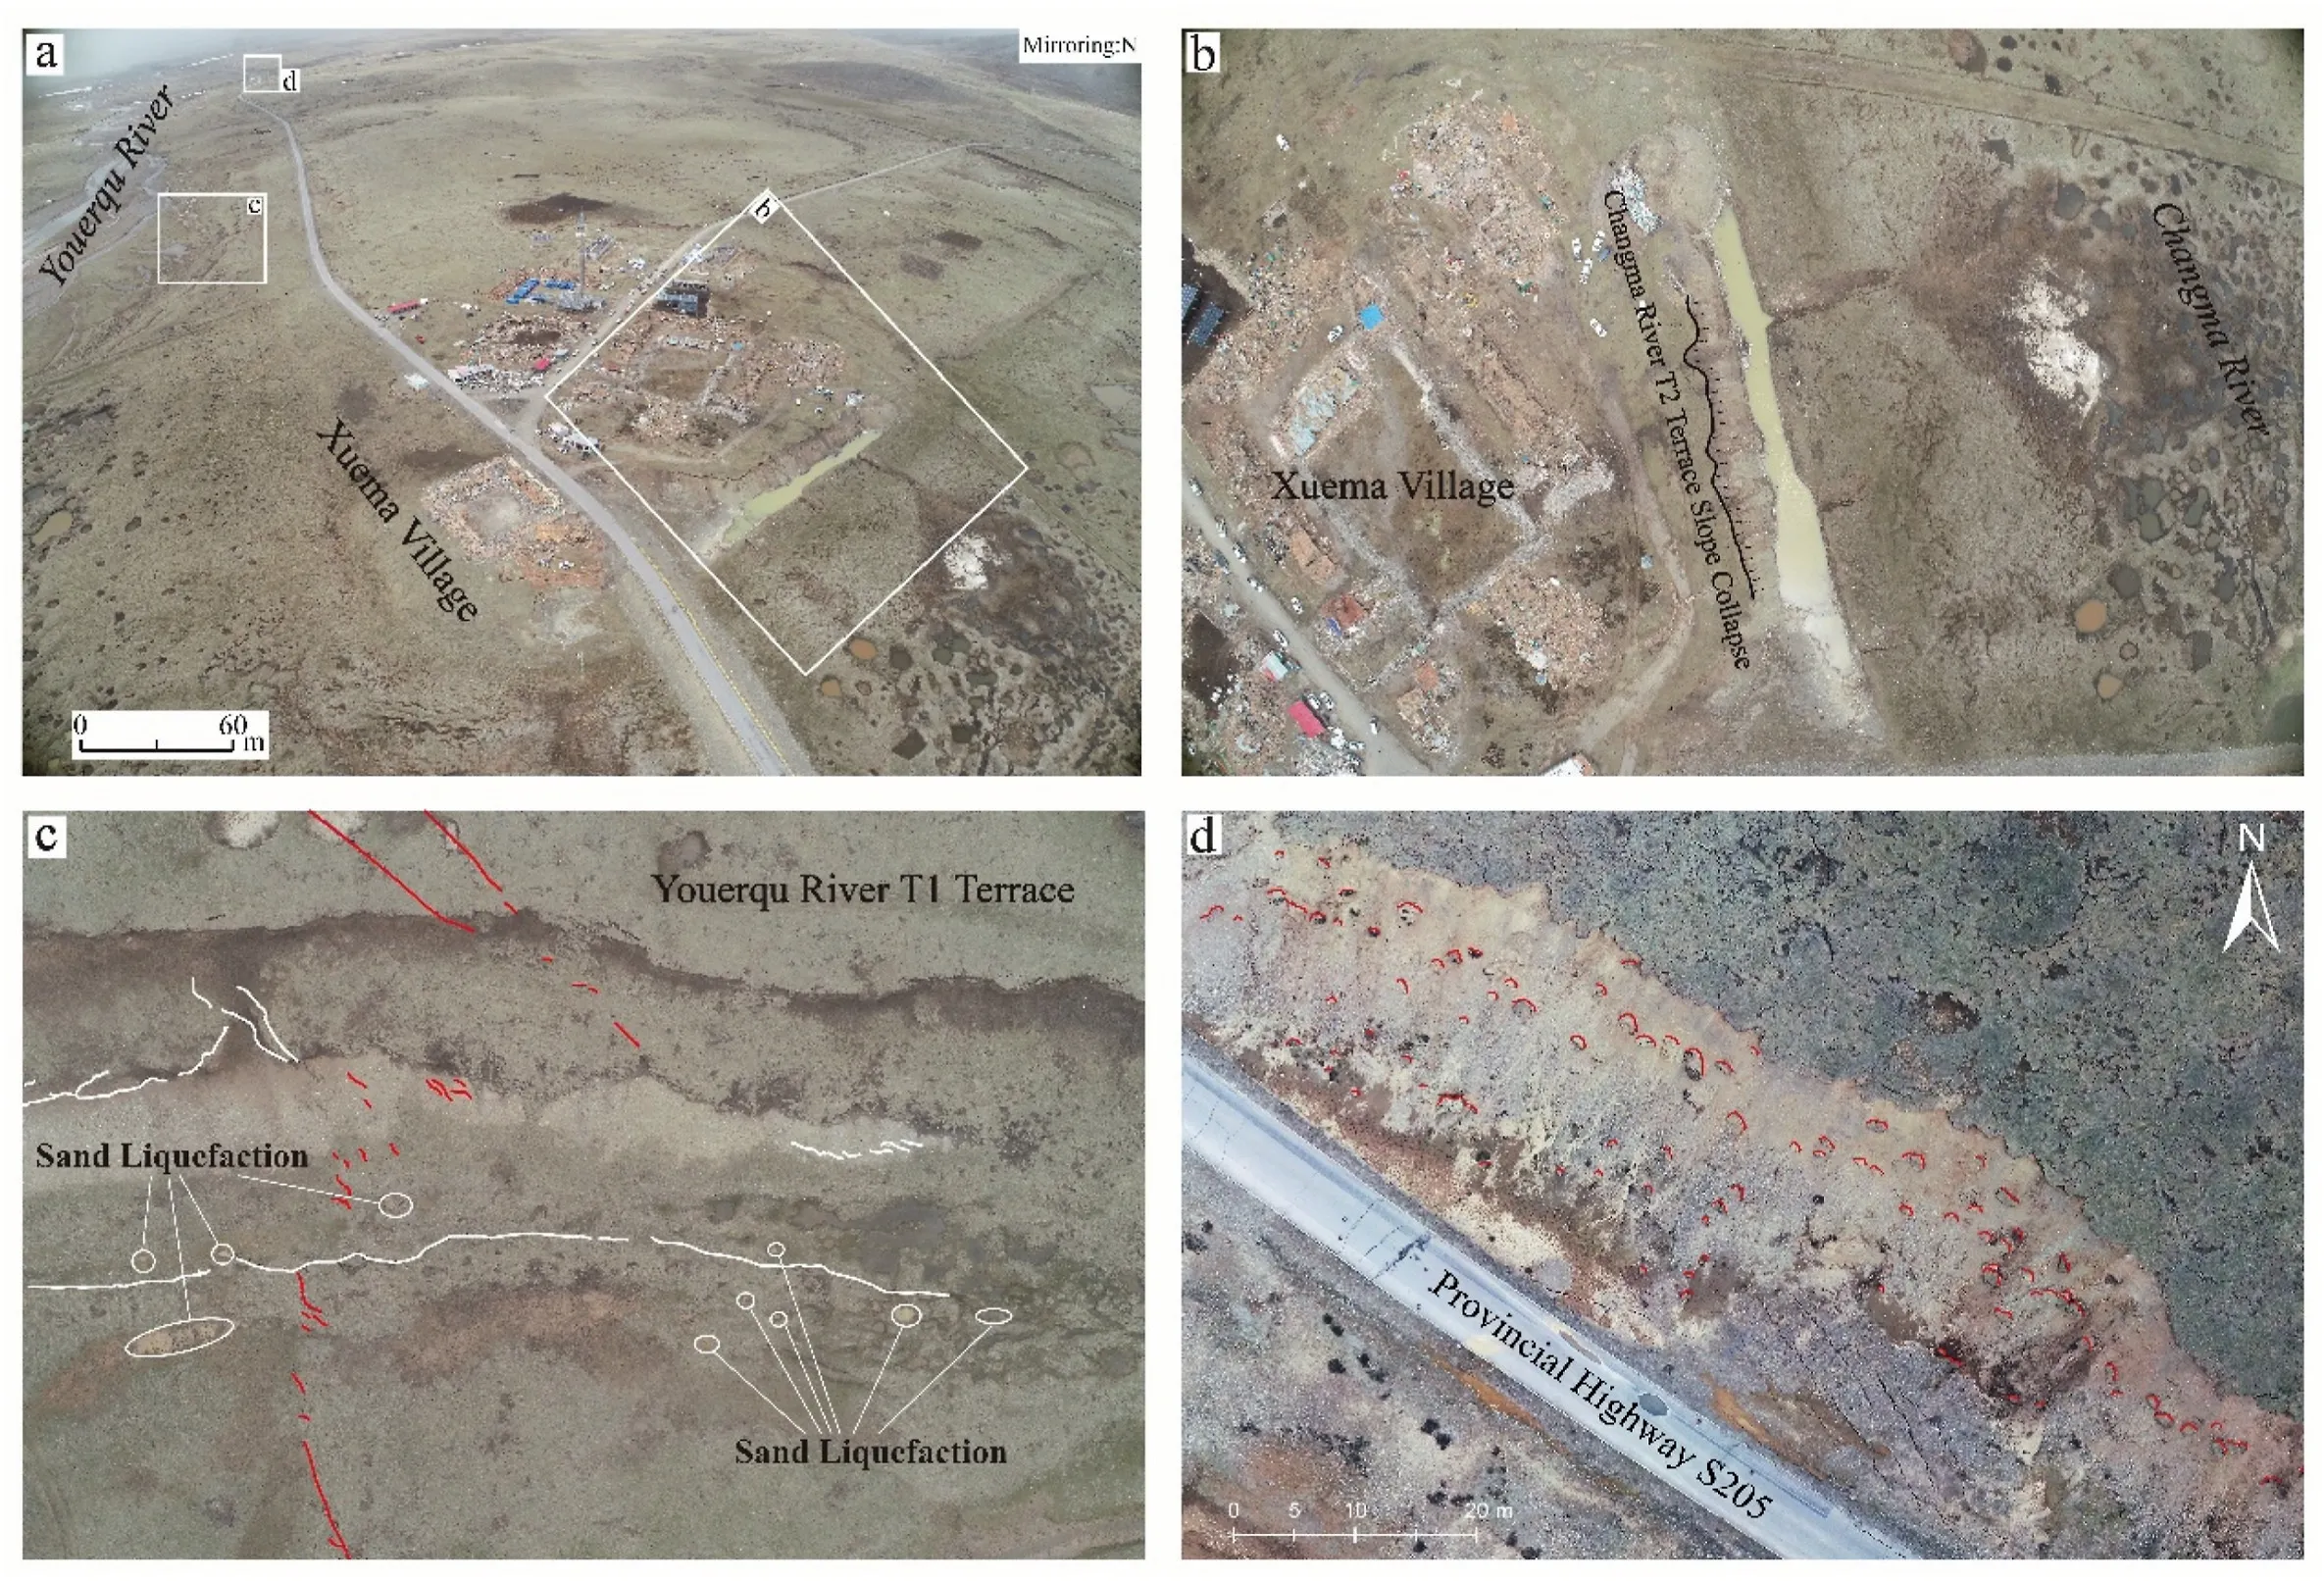
Fig.7.UAV photos of the slope collapses and sand liquefaction near XMV.(a)View of the locations of(b),(c),and(d).The black solid line in(b)indicates the trailing edge of the slope collapse and the black arrow denotes the sliding direction.(c)Middle red solid line indicates the surface fracture,the white solid line delineates the vibration gravity crack on the bank of the Youerqu River,and the white circle indicates the sand liquefaction points.Red arcs in (d) represent the slope collapses.
Damaged roads are observed 100 m NW and 1 km SE of XMV(Fig.10).To the NW,a 40 cm wide seismic crack is seen on Provincial Highway S205 from Huashixia Town to Dari County(Fig.10a).To the SE,80%of the bridge deck collapse on the Changma River Bridge,severely blocking the road.No obvious damage to the bridge pier is observed(Fig.10b).
4.2.Ground penetrating radar data
Seven GPR profiles are obtained across the rupture zone in the study area.Fig.11a,b,d,e,and fall havean orientation in NW–SE,whileFig.11c is oriented E–W near the rupture zone.The frequency of all survey lines is 100 MHz and the dot pitch is 0.2 m.Fig.11 shows the interpreted results.There are no abnormal reflections in the easternmost survey line,and no cracks are observed on the corresponding ground surface.
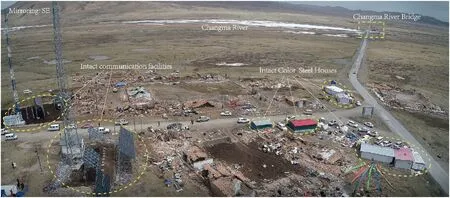
Fig.8.UAV side photo showing the damage level in XMV and the Changma River Bridge associated with the mainshock.

Fig.9.Photos of the earthquake damage in XMV.

Fig.10.Photos showing earthquake damage to road facilities near XMV.

Fig.11.Relationships between the GPR sections and their locations.Black dashed circle indicates the abnormal detection area.The black arrow indicates underground cracks,the white arrow indicates the interference source,and the white square indicates the location of the ground surface rupture.Black solid lines mark the location of the GPR survey lines and the red solid line indicates the surface crack.
The GPR profile contains an abnormal zone with a width of 30 m at the corresponding location of the surface rupture.The radar-reflected waves are distorted and reflected by multiple reflections with depth greater than 27 m.Such phenomenon is interpreted as a rupture zone.Section b contains two strong reflection stripes of electromagnetic wave reflection waveforms extending downward at the location of the surface rupture.The northern strip converges downward with the other stripe at a depth of 15 m,and no downward extension is observed.As shown in Fig.11b,this is interpreted as two secondary cracks (black arrow).Section c contains five anomalies at the locations of the surface ruptures.Clutter features and multiple reflections are also prominent at the end of the section.The corresponding surface also contains cracks;therefore,this section is interpreted as a rupture zone.Surface cracks at the initial end of the section exhibit abnormal positions and strong waveform reflections,but only extend to 8 m in depth.We consider that these surface cracks are not seismic surface deformation zones with structural origin.Three abnormally narrow bands are observed in the middle of the section,and the abnormal zone (i.e.the white arrow) in the center is road interference.The other two are surface ruptures that extend downwards,reaching the maximum detection depth (27 m).In the profile,two strong reflection bands are observed at the northern terminus of the section,none of which extend downward by more than 10 m.We infer that these bands correspond to the collapsed cracks on the right bank of the Youerqu River(white arrow indicates the location of the barbed wire).In the profile,a strong reflection zone is observed at 30 m on the southern side of the profile.This zone also extends to the maximum detection depth.However,no surface cracks are reported in the field surveys.Therefore,we speculate that the seismic energy is absorbed and does not extend to the surface.This GPR section also indicates that the rupture of the Youerqu River extends westward.In the profile,an abnormal band is observed at the location of the surface crack that extends downwards to 12 m.This feature is interpreted as a tensile crack at the end of the rupture extension,and its depth extent is limited (Fig.11).
The GPR results indicate that the surface ruptures within the detection range extend to a maximum depth of 27 m.No surface ruptures are observed on the right bank of the Youerqu River;however,GPR results indicate that the ruptures appear below the surface,but do not extend to the surface.The NW-trending crack on the left bank of the Youerqu River does not extend downward for more than 10 m.Such phenomenon is interpreted as a seismic gravity crack.As the fracture zone extends eastward,the depth of the crack has become increasingly shallow.
Based on the information provided by field surveys and previous studies,the seismogenic fault of the Madoi earthquake is the KLSK-JCF,and the length of the surface rupture zone is greater than 160 km (Gai et al.,2021;Li et al.,2021a,b;Pan et al.,2021;Zhan et al.,2021;Yin et al.,2021).InSAR inversion results indicate that the rupture length reaches~210 km,the maximum sliding distance is~6 m at a depth of 5 km,and the overall slip length on the eastern side of the rupture zone is larger than that on the western side(Hua et al.,2021).In addition,GNSS observations propose that the maximum coseismic slip occurs in the region east of the epicenter(Li et al.,2021a,b;Yuan et al.,2022).According to the field survey results,the surface dislocation east of the rupture zone is smaller than that to the west to the rupture zone.In the west,Pan et al.(2021) obtain a 2.9 m dislocation value,while Li et al.(2021b) suggest that the value is 1.4 m.By contrast,Gai et al.(2021) obtain a 1.1 m dislocation value in the east.Comparison features and subsurface structures indicate that the amounts of surface dislocation and underground sliding affected by the regional geological conditions are not well fitted.This comparison also indicates that a tail-end effect may be responsible for the tension zone at the eastern end of the rupture zone (Deng et al.,1989;Xu,1990;Xu and Deng,1990).Although the amount of underground slip is large,the scale of energy transferred to the surface is not correspondingly large.The ruptures lead to slope collapses 2.5 km to the north,while the Changma River Bridge collapses 1.3 km to the south with a total width of 3.8 km.No surface phenomena are observed on either side of the extension.As the rupture zone extends eastward,the scale of the rupture gradually decreases and the depths of the ground fissures approaches the surface.The overall rupture zone exhibits a three-dimensional eastward pinning pattern until the rupture zone disappears.
Earthquake damage in the study area is mainly manifested as house collapses,road cracks,bridge damage,slope collapses,etc (Figs.4,7,9 and 10).Compared with other locations,house and slope collapses are particularly severe(Figs.4 and 8)(Wang et al.,2021a,b).The houses in XMV are mainly made by brick and wood possessing low earthquake resistance.This is the main reason for the serious damage to these houses.Signal base stations and solar power panels have steel frame structures and are thus not substantially affected(Fig.8).The study area is located at the confluence zone of the Youerqu and Changma Rivers with two levels of terraces.A provincial road also intersects this region,and the slope collapses are more likely to occur on terrace ridges and highway slopes.The earthquake occurred during the winter when the soil layers were frozen.Below a certain depth,sliding occurred in the dominant direction of the gravitational potential energy along the terraces under the influence of ground motion and gravity.Surface cracks with intersecting angles were also produced(Fig.6b).
In this study,we investigate the characteristics of the rupture zone and the damage level at the eastern end of the MS7.4 Madoi earthquake occurred on May 22,2021 using field surveys,UAV surveys,and GPR.The overall scale of the earthquake surface rupture decreases from west to east,and the depth of the rupture gradually decreases to the east until it pinches out.However,an anomalous intensity is observed at the eastern end of the rupture zone,far from the epicenter.Such anomaly does not match the scale of the surface ruptures.Furthermore,residential houses in the immediate area are not made by earthquake-resistant structures,which is also a primary reason for the observation of the abnormally high intensity.This region is also the zone where the direction of the rupture zone changes from WNW to ENE–E–W.Therefore,we infer that stress and energy are strongly accumulated in this area,resulting in catastrophic coseismic damage.In general,we suggest that the seismogenic fault of the MS7.4 Madoi earthquake exerts a tail-end effect at the eastern end of the rupture zone,and the extensional zone may account for the eastward decrease of the rupture scale.In addition,the earthquake damage is extensively large in the east,possibly attributed to the effect of pre-existing topography and the changes in the strike of the rupture zone.
Funding
This research was supported by the National Natural Science Foundation of China (42072248,42041006),the National Key Research and Development Program (2021YFC3000601-3,2019YFE0108900),and Scientific Research Project of China Datang Corporation Ltd.(DTXZ-02-2021).
Declaration of competing interest
The authors declare that they have no known competing financial interests or personal relationships that could have appeared to influence the work reported in this paper.
Acknowledgement
We are grateful to Prof.Zhimin Li at the Earthquake Administration of Qinghai Province,and Prof.Tao Li at the Institute of Geology,China Earthquake Administration for their assistance with fieldwork.We also thanks to the drivers Yuanjun Yang,Haifeng Wang,Qingchun Chen,and Zhengcairang Dan for their help during the whole field surveys.
推荐访问:characteristics earthquake damage